One page a month, per lorry. What it earned, what it cost, what it left you, and the return on the money you have tied up in it. Owned lorries and lorries you hire in, side by side.
Built and read by a chartered accountant. It is an operating statement for running a fleet — not a second set of books.
Your books tell you what the business made. They do not tell you which lorry made it, or what your own money earned while it did. On rupees alone the answer looks obvious. On return it usually is not.
| One month, five lorries | Lorries | Profit | Your capital | Return |
|---|---|---|---|---|
| Your own lorries | 3 | 1,03,225 | 44,14,301 | 2.0% |
| Hired in per trip | 2 | 1,00,546 | 5,11,245 | 37.1% |
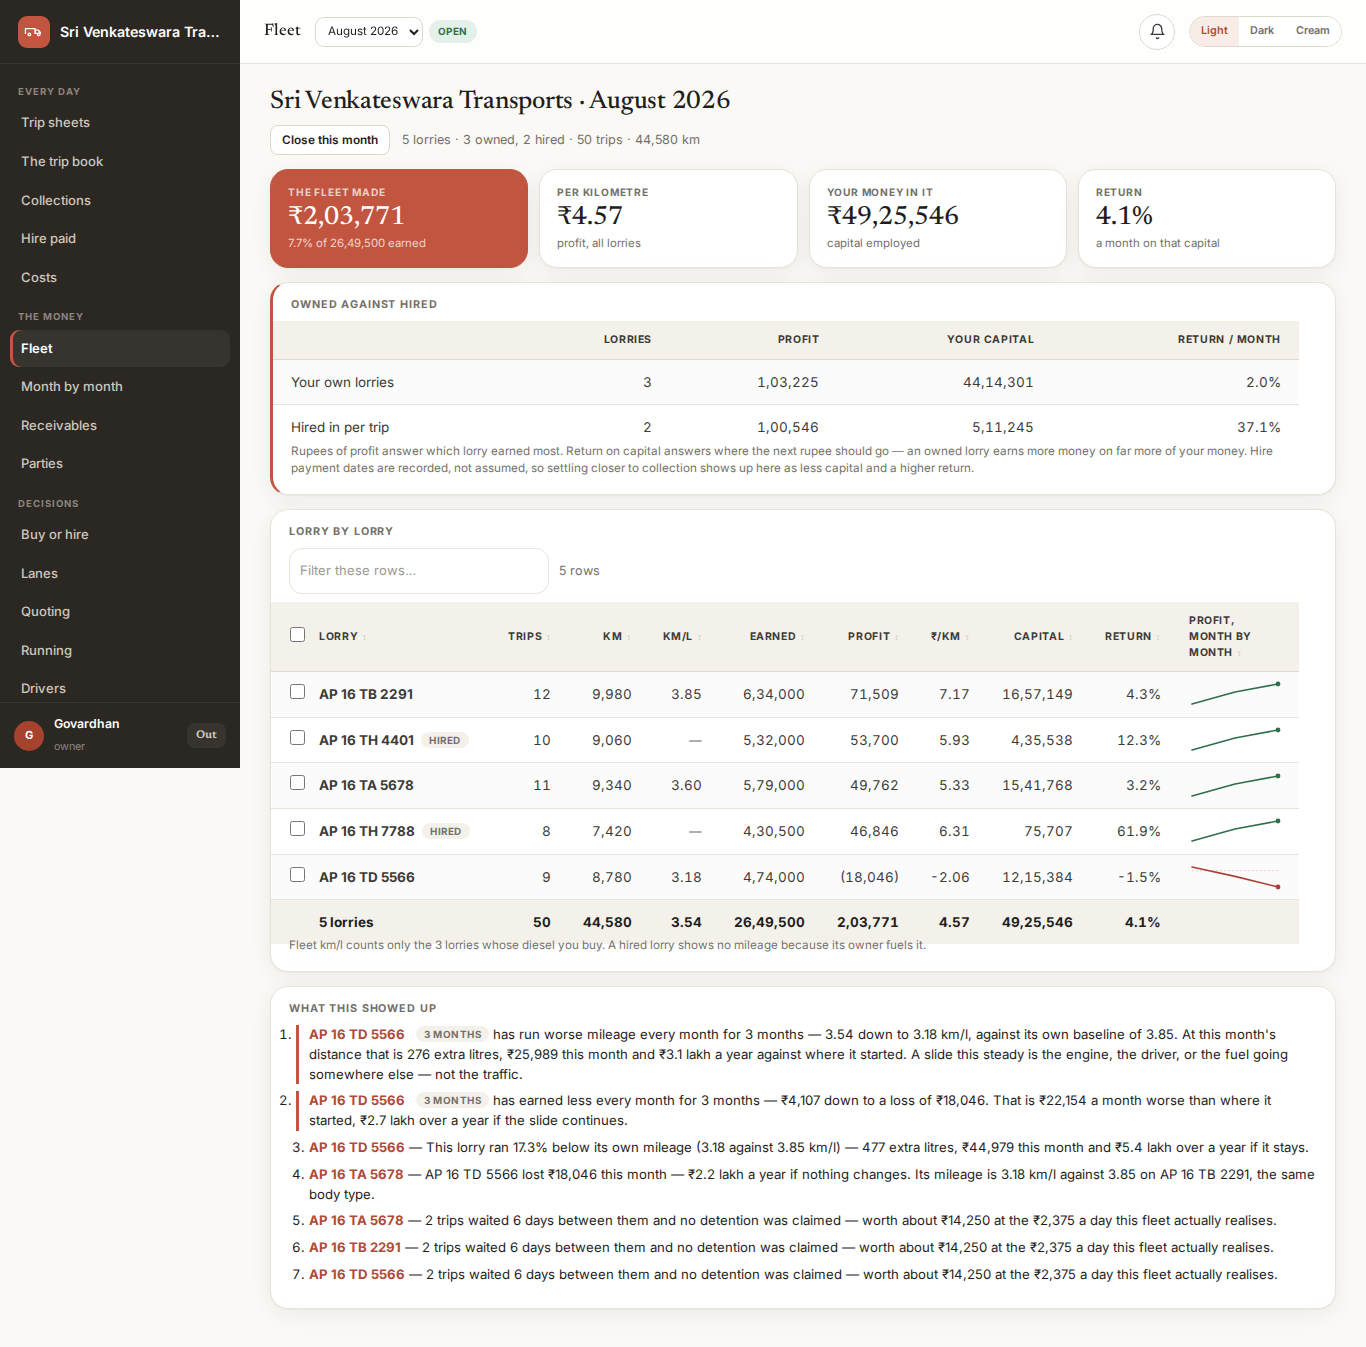
Nothing here is an opinion about anybody. Each finding is a figure with the rows behind it, ranked by what it costs you in a year.
Not against the other lorries — against what this one normally does. A 4.7% gap on one lorry was 123 extra litres, ₹11,596 in the month, ₹1.4 lakh a year.
Trips that waited two days or more and were never billed for it, valued at the rate the fleet actually realises — not a rate from a rulebook.
Money that came in below what was billed. Explained shortfalls are a decision; the unexplained ones are the bucket worth emptying.
Odometer span against billed trip kilometres. The running between one delivery and the next load appears in no book anywhere else.
On hired trips, the gap between the two dates is your working capital. Settling closer to collection frees it, and the report prices it.
What share of a month's spending has a bill you could actually produce. On one fleet: ₹74,439 of ₹8.51 lakh had neither a scan nor a bill claimed.
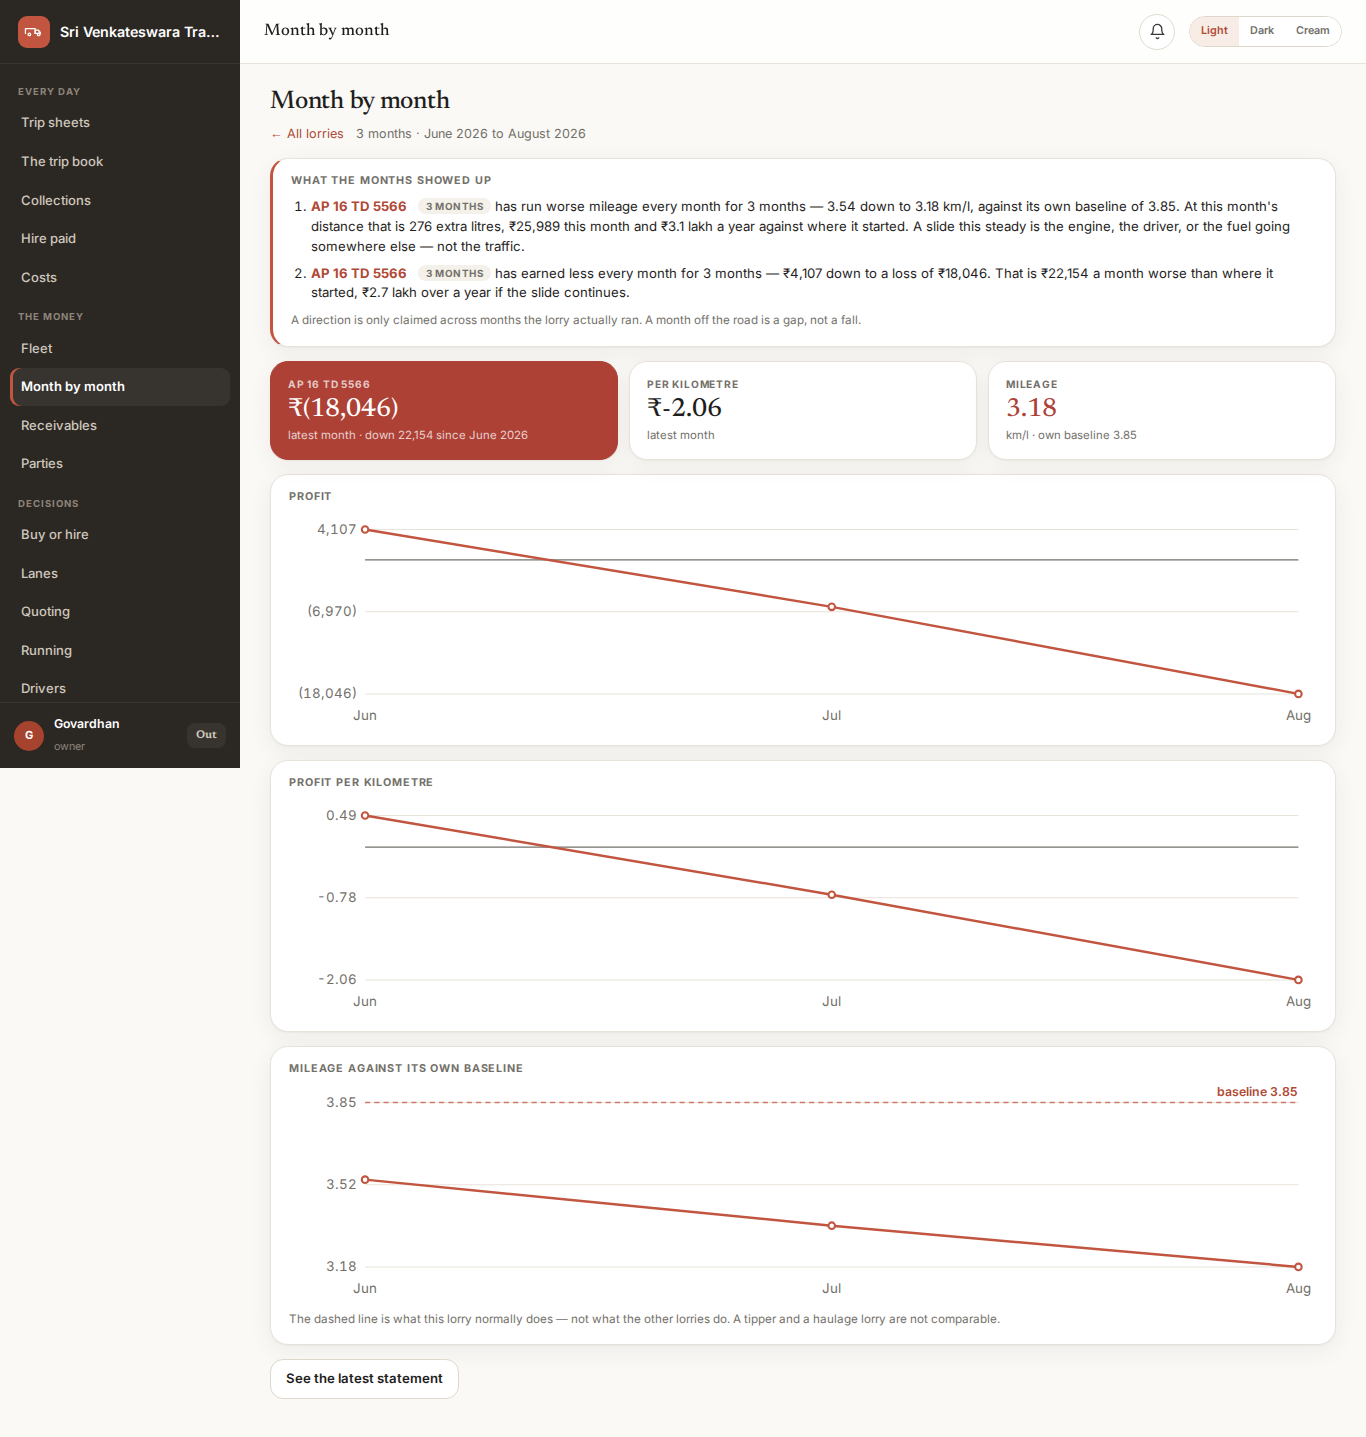
Any month tells you which lorry lost money. Three months tell you which one is going wrong, and roughly when it started — which is the difference between a repair and a write-off.
Profit, rupees per kilometre and mileage, drawn against each lorry's own history. A month a lorry did not run is a gap in the line, never a zero — a zero would show a collapse that did not happen.
One lorry's mileage fell 3.54 to 3.18 km/l across three months against a 3.85 baseline: 276 extra litres, ₹25,989 in the month, ₹3.1 lakh a year. A slide that steady is the engine, the driver, or the fuel going somewhere else.
A run of three falling numbers is easy to find and usually means nothing. A finding has to be worth at least a hundredth of what that lorry earned that month, or it is not shown at all.
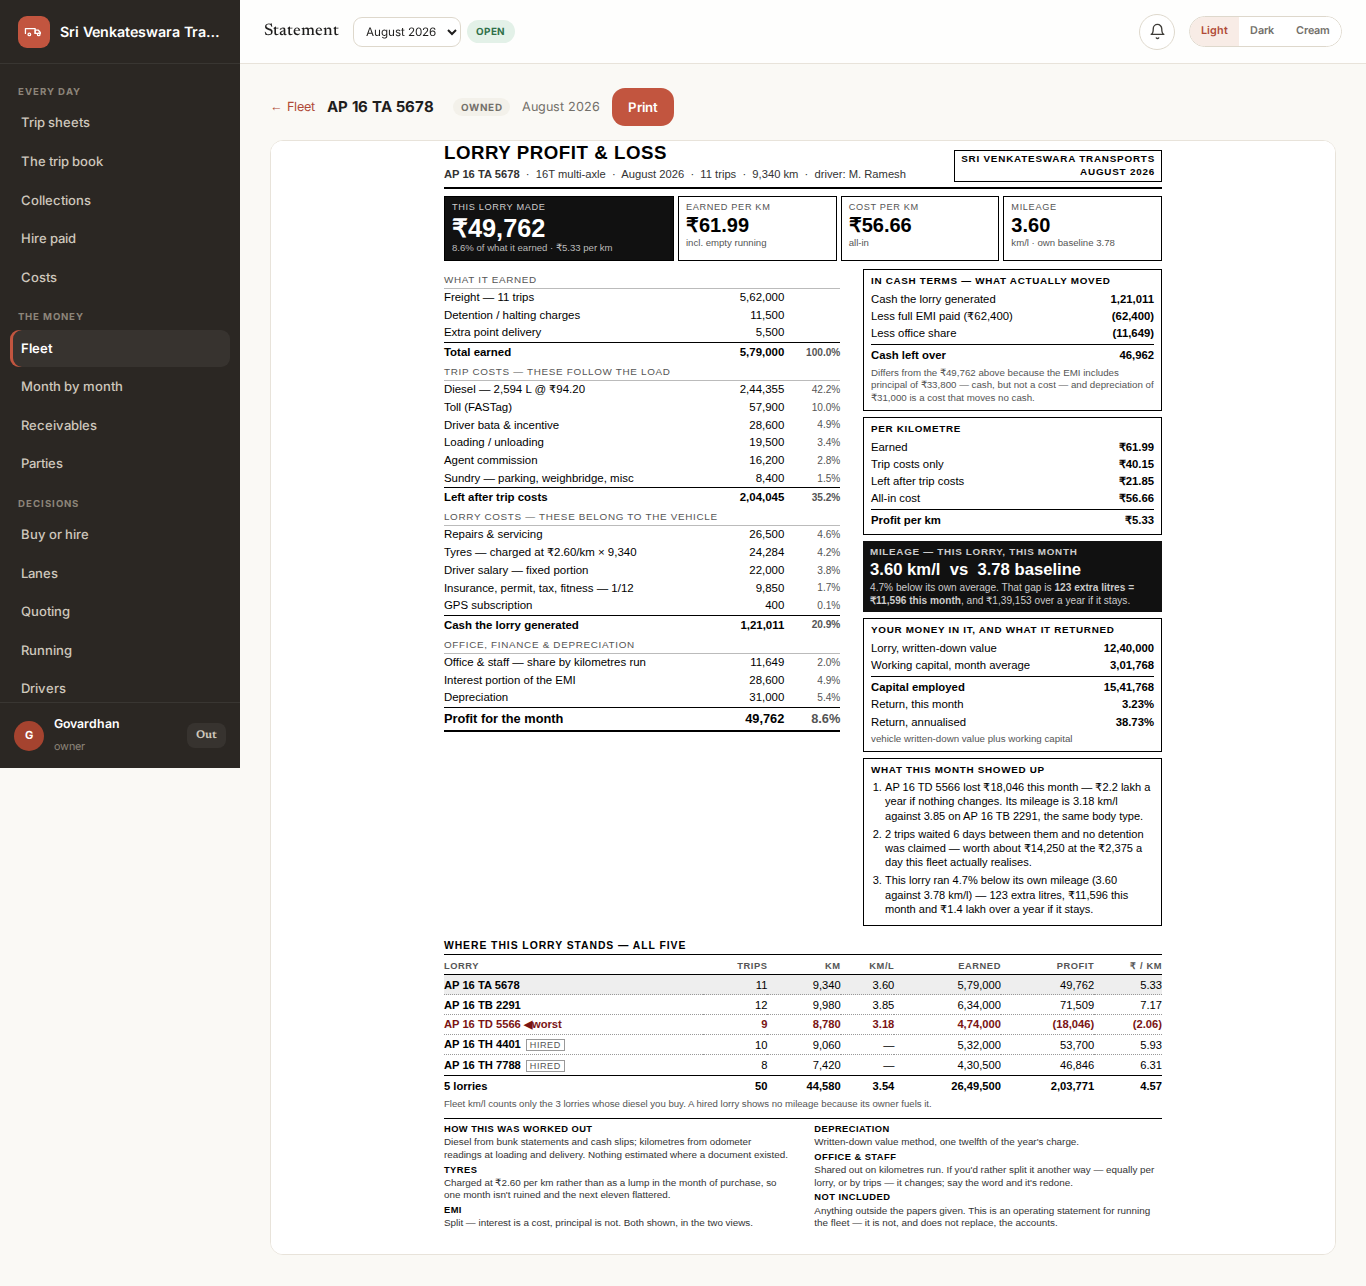
Dense, plain and printable — the way a chartered accountant sets out a statement, not the way software shows a dashboard. Four cost layers, a cash reconciliation, per-kilometre working, and the method stated at the foot so every figure can be argued with.